Fenómeno de la cadena de suministro / concepto de gestión de operaciones
Fenómeno de la cadena de suministro / concepto de gestión de operacionesEfecto látigo
Bullwhip Effect
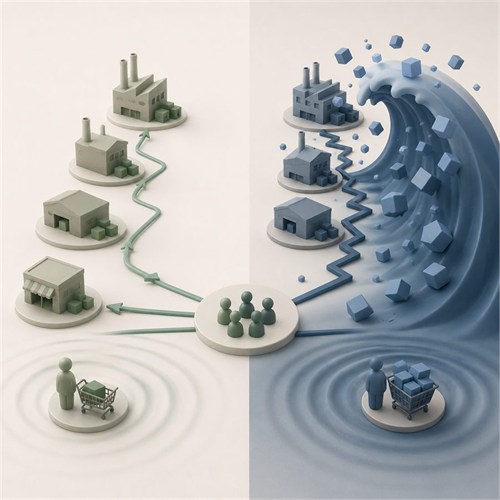
Comparte datos reales de demanda, reduce los tiempos de entrega, evita el agrupamiento artificial de pedidos, suaviza las promociones y alinea los incentivos en toda la cadena de suministro; de lo contrario, una pequeña ondulación en la demanda de los clientes puede convertirse en un tsunami corriente arriba.
Popularidad
Utilidad
Alias
Efecto Latigazo / Efecto Síerrameza / Efecto Forrester / Amplificación de la Demanda
Dominios
Gestión de la Cadena de Suministro / Gestión de Operaciones / Logística / Gestión de Inventarios / Pensamiento Sistémico
Definición
- El efecto látigo es un fenómeno de la cadena de suministro en el que la variabilidad de los pedidos se vuelve mayor a medida que la información de la demanda se traslada aguas arriba, desde los clientes hasta los minoristas, mayoristas, distribuidores, fabricantes y proveedores.
Idea central
- Pequeños cambios en la demanda real de los clientes pueden convertirse en oscilaciones mucho mayores en los pedidos aguas arriba, el inventario, los programas de producción y la planificación de la capacidad.
- El problema no es solo el cambio en la demanda en sí, sino la distorsión de la información de la demanda a medida que cada capa de la cadena de suministro reacciona a señales incompletas, retrasadas o interpretadas.
Cómo funciona
- Un minorista observa un cambio en la demanda de los clientes y ajusta su pedido.
- El mayorista trata el pedido del minorista como una señal de demanda y ajusta su propio pronóstico y stock de seguridad.
- Luego, el fabricante reacciona al pedido más grande del mayorista.
- Cada nivel puede añadir inventario extra, hacer pedidos por lotes, reaccionar a promociones o pedir en exceso durante escaseces.
- Lee, Padmanabhan y Whang identificaron cuatro causas principales: actualización del pronóstico de demanda, pedidos por lotes, fluctuación de precios y racionamiento / manipulación de la escasez.
Ejemplo de uso
- Un supermercado observa un aumento temporal en las ventas de agua embotellada y realiza pedidos superiores a los habituales.
- El distribuidor asume que la demanda está aumentando y pide aún más al fabricante.
- El fabricante aumenta la producción, pero más tarde la demanda minorista original vuelve a la normalidad.
- Resultado: exceso de inventario aguas arriba, horarios de producción inestables, costos de almacenamiento mayores y posibles escaseces o descuentos posteriores.
Ejemplo famoso
- Ejemplo: La cadena de suministro de pañales Pampers de Procter & Gamble es un ejemplo comúnmente citado. Lee, Padmanabhan y Whang informaron que las ventas minoristas de Pampers eran relativamente estables, pero los pedidos de los distribuidores variaban más, y los pedidos de P&G a los proveedores variaban aún más.
- Por qué encaja en esta regla: El consumo de pañales para bebés era relativamente constante, pero las señales de pedido se amplificaban a medida que avanzaban hacia arriba en la cadena de suministro.
Casos de uso / situaciones en las que aplica
- Cadenas de suministro de bienes de consumo y retail
- Planificación de la producción manufacturera
- Decisiones de inventario y stock de seguridad
- Redes de logística y distribución
- Mercados con muchas promociones, descuentos, cupones, reembolsos o compras anticipadas
- Situaciones de escasez donde los compradores pueden sobrepedir para asegurar suministro limitado
- Cadenas de suministro multinivel con largos tiempos de entrega o mala compartición de información
Cuándo no usarlo o mal uso habitual
- No lo use para todos los casos de alta demanda; la característica clave es la amplificación río arriba de la variabilidad.
- No lo use cuando todas las capas de la cadena de suministro reaccionan directamente a los mismos datos de demanda verificada del cliente sin distorsión.
- No lo confunda con un simple agotamiento de stock, un retraso logístico único o la estacionalidad ordinaria.
- No asuma que el efecto es causado únicamente por un comportamiento irracional; Lee, Padmanabhan y Whang argumentaron que las decisiones racionales bajo estructuras comunes de la cadena de suministro también pueden crearlo.
Origen de la regla / invención
- Inventado por: Ningún inventor único. El trabajo de Jay W. Forrester de 1961 sobre dinámica industrial se considera comúnmente como la base formal temprana para la amplificación de la demanda, mientras que el término “Efecto látigo” se asoció más tarde con P&G y fue popularizado en la literatura de gestión de la cadena de suministro por Hau L. Lee, V. Padmanabhan y Seungjin Whang.
- Año de invención: 1961 para el tratamiento formal temprano de sistemas dinámicos; 1997 para las publicaciones académicas/empresariales influyentes que utilizan la terminología Efecto látigo.
- País / contexto de origen: Estados Unidos; contextos de dinámica de sistemas, gestión de operaciones y gestión de cadenas de suministro que involucran al MIT, Stanford y cadenas de suministro de bienes de consumo.
Conclusión práctica breve
- Comparta datos reales de demanda, reduzca los tiempos de entrega, evite el agrupamiento artificial de pedidos, suavice las promociones y alinee los incentivos a lo largo de la cadena de suministro; de lo contrario, una pequeña ondulación en la demanda del cliente puede convertirse en un tsunami río arriba.